Whether you’re an avid user of Microsoft Word, PowerPoint, Outlook, or Excel, sooner or later you’ll have a need to insert a chart in your document, presentation, email or spreadsheet.
In the old days, Excel was the master at creating charts, leaving the other Office applications a bit lacking in the arena of chart making. Most users would use Excel to create the chart and then copy the chart into a different application. Although there are ways to link the Excel chart to the chart copy in the companion program, most users usually just pasted the chart as a copy, losing the ability to receive updates when chart data changed.
Another pitfall to designing the chart in Excel and viewing the chart in a different application, the user must now maintain two separate files. If the chart was copied to a Word document or added to a PowerPoint slide, and then emailed to a different user, the recipient would no longer have access to the original chart if changes were needed, unless the companion Excel file came along for the ride.
The New Way of Creating Charts
Microsoft has changed the way charts are made in Microsoft Office applications. Regardless of your application you can create a chart using Excel while never leaving the original application. As odd as that sounds, here is how it works.
Using Microsoft Word as an example, suppose you are writing a report and need to include a chart between two paragraphs of text. Add a blank line between the two paragraphs and then venture up to the Insert tab, and in the Illustrations group select Chart.

Microsoft will present an Insert Chart dialog box that has all of the available chart types featured in Excel.

Excel will take command and present a “Mini Excel” spreadsheet with some sample data, just so you can visualize the selected chart.
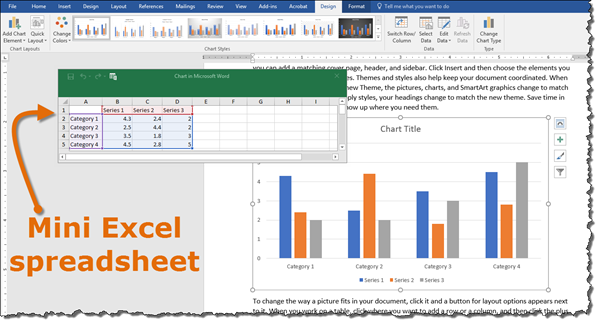
The Mini Excel window is resizable to accommodate data sets of any size.
All of the standard Excel chart functionality is available via the Design and Format ribbons at the top of the application.


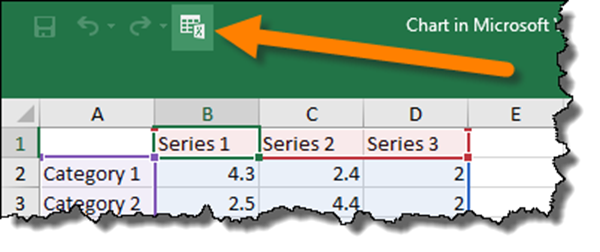
If more advanced Excel features are required to complete the chart, clicking the Open in Excel button in the upper-left corner of the Mini Excel window will open the chart’s data set in Excel where any Excel feature or tool can be accessed.
When data entry is complete, clicking the close button ![]() in the upper right corner of the Mini Excel window will close the spreadsheet and deliver the finished product to the original application.
in the upper right corner of the Mini Excel window will close the spreadsheet and deliver the finished product to the original application.
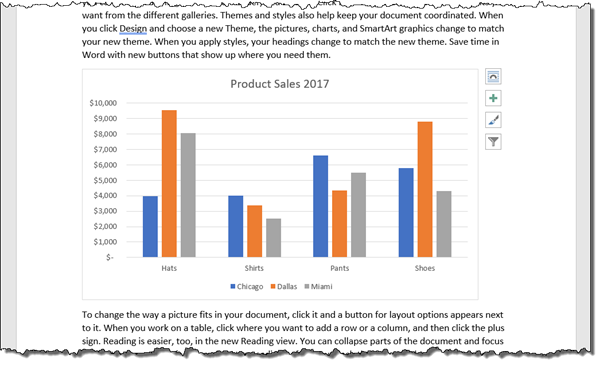
If the chart needs to be updated, accessing the original data is accomplished by right-clicking on the chart and selecting Edit Data. The chart can be edited in either the Mini Excel window or the full Excel program.
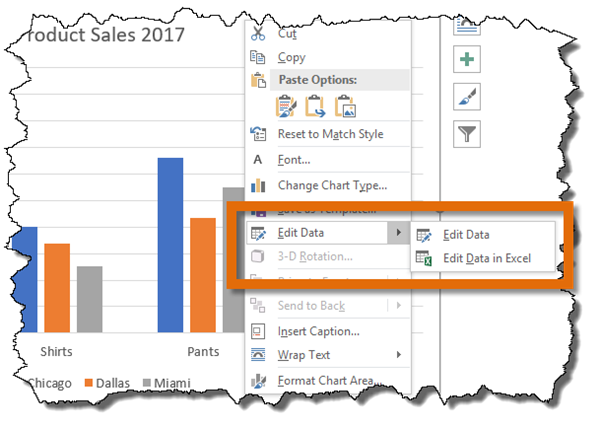
If the file is sent to a colleague, the original Excel data is always available for editing due to the embedded nature of the chart data.
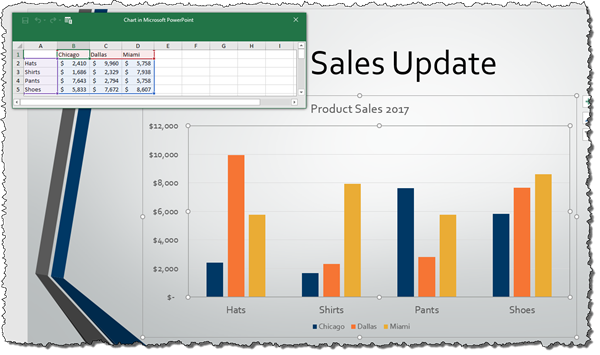
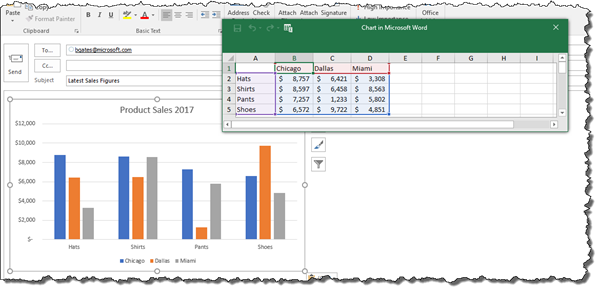
Below is a snapshot of performing the same operation in a PowerPoint slide and an Outlook email message.
