When it comes to delivering data in a visually compelling manner, there are few programs on the market as capable as QlikView; a product developed by Sweden-based Qlik ( www.qlik.com ). Because of the sheer volume of displayable information, the viewer can be easily overwhelmed with stories and possible idea paths. To help minimize the number of visual locations, yet still provide the necessary visuals, selective hiding and unhiding of objects is a clever strategy.
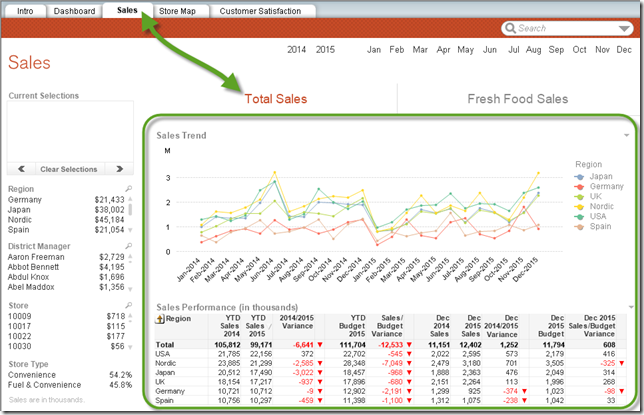
Take the following “Retail Store Performance” example (the sample file used in this tutorial is available for download or online testing by clicking here):
There are two dashboards that need to be displayed; the “Total Sales” and the “Fresh Food Sales”.


Because these are two separate stories, and packing all of the charts and tables on a single sheet would be both overwhelming and difficult to read, the stories are separated onto two different sheets.

Because the stories share a similar theme, “sales”, let’s employ a sneaky little trick to allow the user to switch between the two sheets while giving them the illusion they are switching between objects on a single sheet.
Step 1: Create a “Light Switch” Variable
By using a variable, we can conditionally display objects based on the value contained in the variable. Imagine “Object A” only displaying when the variable contains a “1” but hiding when the variable contains any other value. We could have “Object B” displayed when the variable contains a “2” and hidden when the variable contains any other value. We can then add an action to any object that will populate the variable with a “1” or a “2” when clicked.
To create the variable, in QlikView select Settings and then click Variable Overview from the dropdown menu (Ctrl-Alt-V).
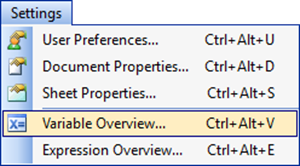
In the Variable Overview dialog box, create a variable called “vSales” (or any name you deem memorable.)

You don’t need to populate the variable at this time; it will be populated by actions we take on other objects.
Step 2: Set the Objects Visibility Conditionally
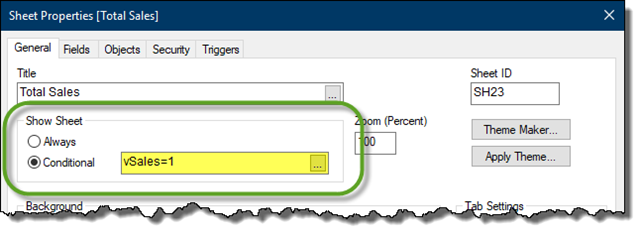
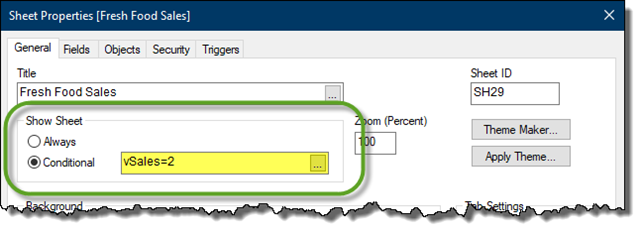
In our example we have two sales sheets with very similar structures. All of the filter/selection/search objects are identical with only the middle charts being different. We will set the “Total Sales” sheet to only display when the “vSales” variable is set to “1”, and the “Fresh Food Sales” sheet to only display when the “vSales” variable is set to “2”.
Open the sheet properties dialog box for the “Total Sales” sheet. On the General tab, in the Show Sheet section, select Conditional and populate the field with “vSales = 1”. Close the dialog box when finished.
Open the sheet properties dialog box for the “Fresh Food Sales” sheet. On the General tab, in the Show Sheet section, select Conditional and populate the field with “vSales = 2”. Close the dialog box when finished.
Because the end effect will have one sheet taking the place of the other sheet when the “vSales” variable is toggled between “1” and “2”, rename both of the sheets to “Sales”.
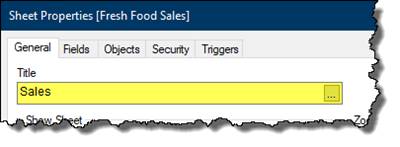
This will provide the illusion of the sheet remaining static and the charts changing.
Step 3: “Oh, No! Where did my sheets go?!?!”
Because we have not set the “vSales” variable to any value, the sheets are not responding to the visibility switch; both are placed in an invisible state.

We need to be able to perform our final tweaks on the currently invisible objects. To bring the invisible objects back to a visible state, on the keyboard, press the key combination Ctrl-Shift-S. This key combination toggles all of the objects that have conditional visibility from “active” to “inactive” and back again.

Step 4: Establish the “Switch Sheets” Controls
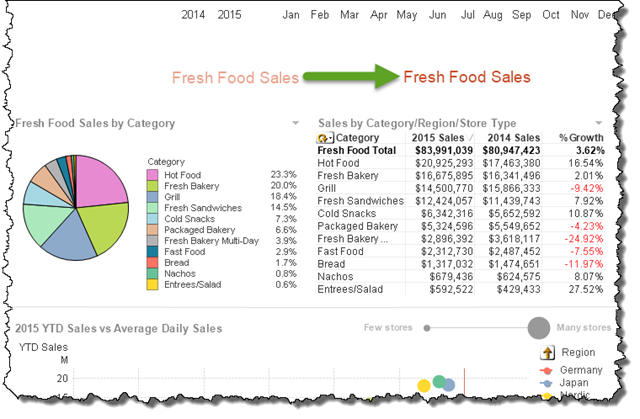
Instead of the user clicking on the sheet tabs to switch between the two sheets, we are going to create titles that respond to clicks. On the first “Sales” sheet for “Total Sales”, move the title “Total Sales” to the left.
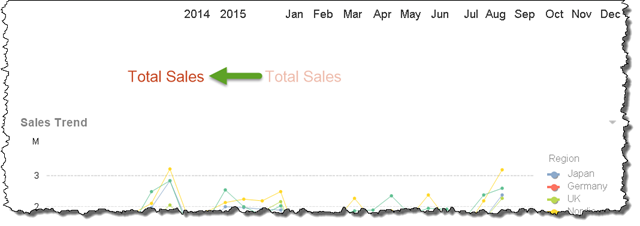
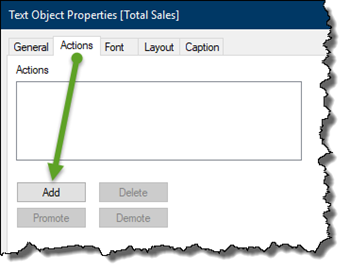
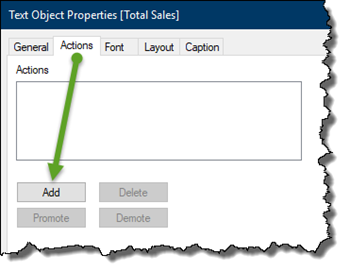
Access the properties of the title “Total Sales”. On the Actions tab, Click the ![]() button.
button.
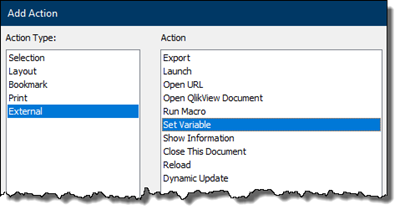
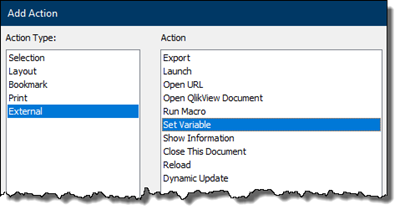
In the Add Action dialog box, select External form the left window and Set Variable from the right window. Click ![]() when finished.
when finished.
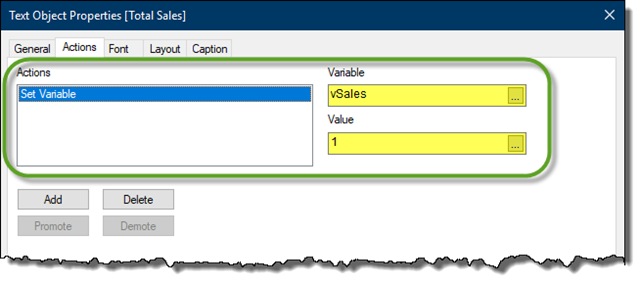
In the properties dialog box, type the name of the “vSales” variable in the Variable field. Type the number “1” in the Value field. Click ![]() when complete.
when complete.
On the second “Sales” sheet for “Fresh Food Sales”, move the title “Fresh Food Sales” to the right.
Access the properties of the title “Total Sales”. On the Actions tab, Click the ![]() button.
button.
In the Add Action dialog box, select External form the left window and Set Variable from the right window. Click ![]() when finished.
when finished.
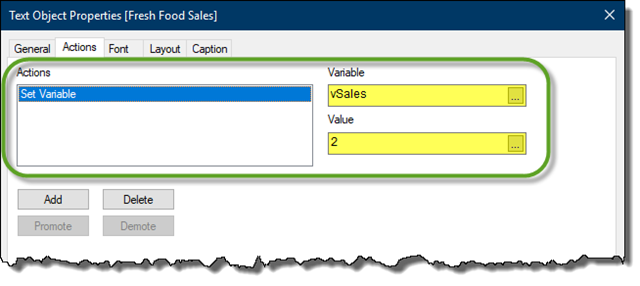
In the properties dialog box, type the name of the “vSales” variable in the Variable field. Type the number “2” in the Value field. Click ![]() when complete.
when complete.
Step 5: Repeat Selection Buttons
To have both buttons accessible on both sheets, select the “Sales” sheet for “Total Sales”. Right-click on the “Total Sales” title and select Copy to Clipboard –> Object.
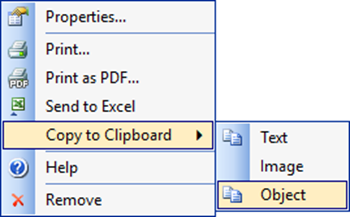
Select the “Sales” sheet for “Fresh Food Sales” and right-click in an empty portion of the sheet. Select Paste Sheet Object as Link.

Repeat Step 5 to copy and paste as a linked object the “Fresh Food Sales” title from the “Sales” sheet to the other “Sales” sheet.
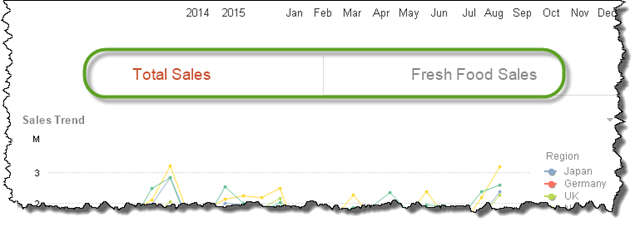
On either of the “Sales” sheets, click on either the “Total Sales” or “Fresh Food Sales” title. This will set a value of “1” or “2” into the “vSales” variable.
Step 6: Re-engage “Hidden” Feature and Test
On the keyboard, press the key combination Ctrl-Shift-S to re-engage the hiding functionality to the “Sales” sheets.
If the “Total Sales” title is clicked, the value of “1” will be added to the “vSales” variable causing the “Total Sales” sheet to appear and the “Fresh Food Sales” sheet to disappear.
Clicking the “Fresh Food Sales” title assigns the value of “2” to the “vSales” variable causing the “Fresh Food Sales” sheet to appear and the “Total Sales” sheet to disappear.
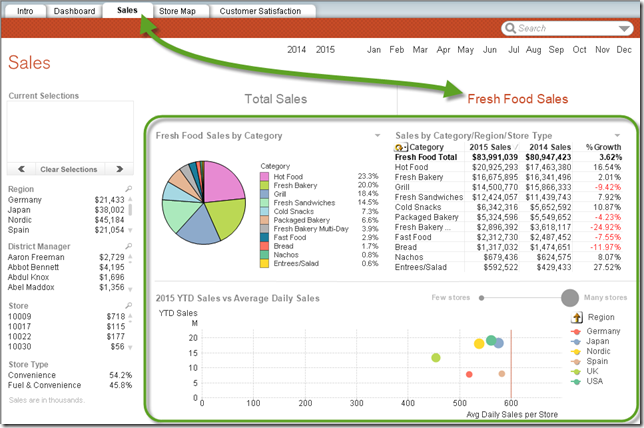
Because the sheets share the same names, the sheet tabs occupy the same position in the tab list, and neither sheet is ever displayed at the same time, the illusion of “switching sheet objects” is achieved.
BONUS:
If you look closely, you will notice that the titles are changing colors depending on the selection status. This is achieved by applying conditional color logic to the respective title’s font color.
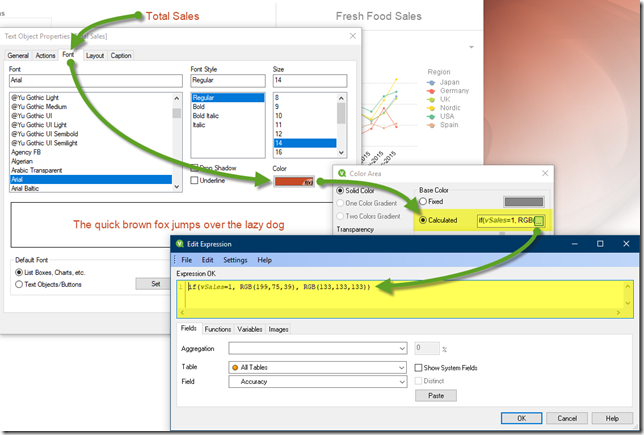
Using the formula in the ”Total Sales” title…
if(vSales=1, RGB(199,75,39), RGB(133,133,133))
… the font color will be Orange when the title is selected and Gray when the title is de-selected.
The formula would be changed to…
if(vSales=2, RGB(199,75,39), RGB(133,133,133))
… for the “Fresh Food Sales” title.

